During my time at Traveloka, I worked with a group of friends on a sentiment analysis of what Indonesians were saying about electric vehicles on Twitter in mid-2022. Electric vehicle discussion was heated at the time because the Indonesian government had just announced plans to subsidize EV purchases, meaning people could buy an electric car or motorcycle at a reduced price. In December 2022, the government announced subsidies of around Rp 8 million for electric motorcycles and Rp 80 million for electric cars, with the formal program launching in March 2023.
One of the findings from that analysis was that even with growing enthusiasm, one of the most common concerns was about infrastructure. Specifically, whether PLN, Indonesia’s state electricity company, could actually support the charging network needed to make EVs viable at scale.
Now that I am in the US, I find that the infrastructure question looks very different here. EV stations exist not just for passenger cars but for freight trucks moving goods across the country. I was curious what that infrastructure actually looks like on the ground. That question led me to the Texas Triangle and two specific questions:
- Can an electric truck run the Texas Triangle freight corridor, I-10, I-35, and I-45, today? Is the charging infrastructure already there to support it?
- How vulnerable is the corridor to disasters that could cause charging outages?
The Data
I pulled EV charging station data from the NREL Alternative Fuels Station Locator via the AFDC API, filtering to public DC Fast chargers in Texas. I combined this with:
- Highway geometry from the US Census TIGER/Line primary roads dataset via the
pygrislibrary - Truck stops from OpenStreetMap via the Overpass API, tagged as fuel stops with heavy vehicle access or highway rest areas
- A 25-mile corridor buffer around I-10, I-35, and I-45, representing the detour distance a truck driver could reasonably take to reach a charger and return
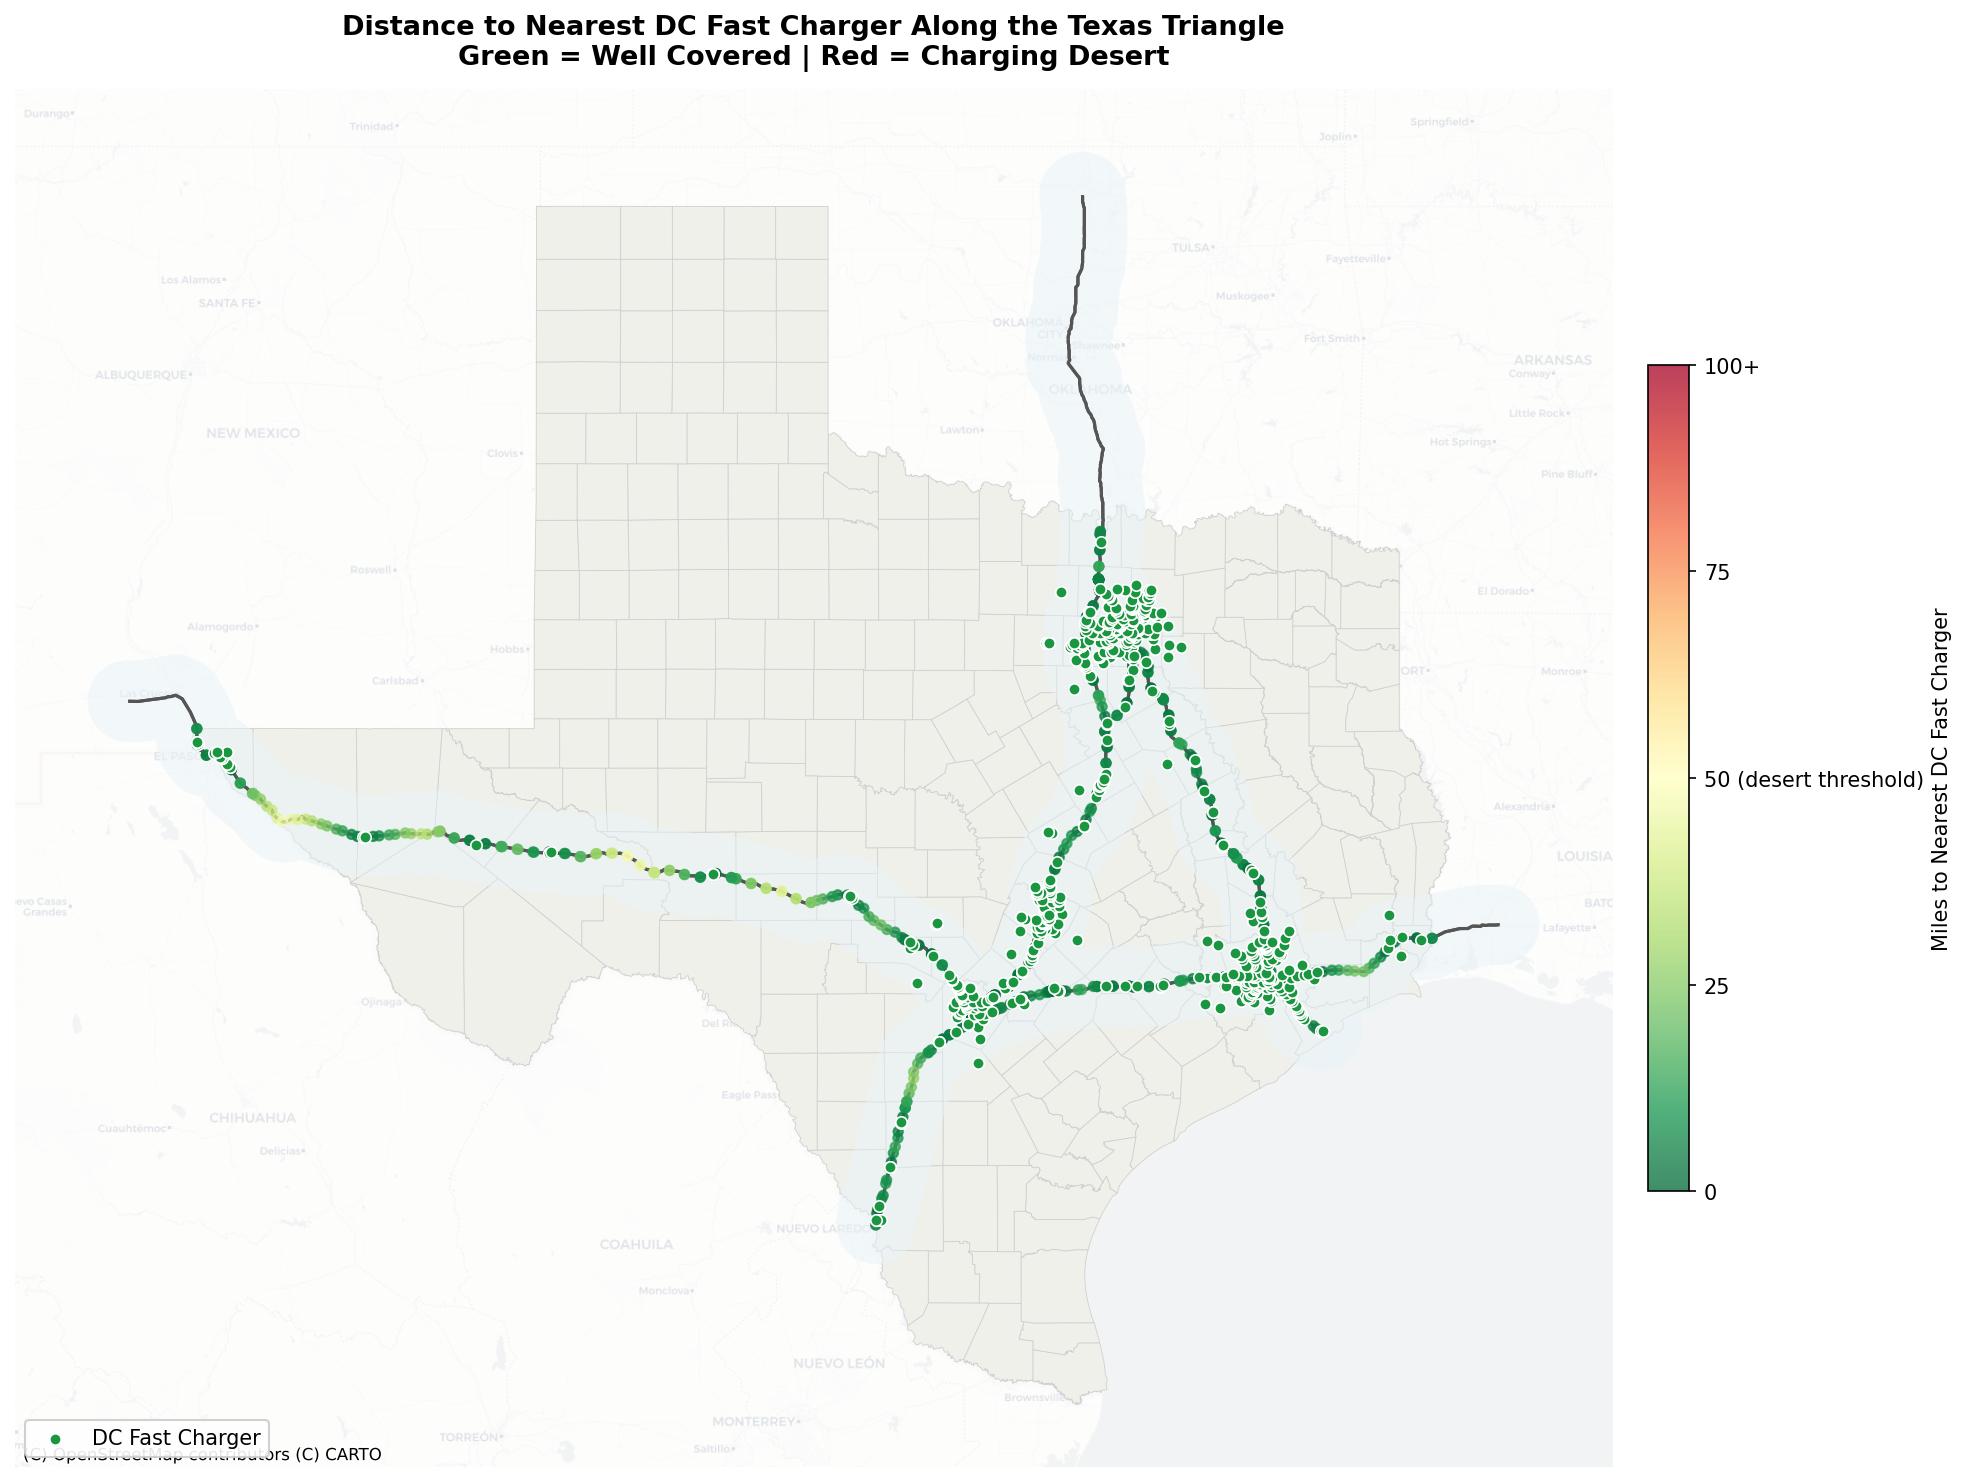
Sample points were placed every 10 miles along each highway centerline, 750 points in total. Any point more than 50 miles from the nearest DC Fast charger is flagged as a charging desert, wide enough to strand a loaded electric semi running below peak range.
Finding 1: The Texas Triangle is Well-Covered
The Texas Triangle is the freight corridor formed by I-10, I-35, and I-45, connecting three of the largest cities in Texas, Houston, San Antonio, and Dallas, along some of the most trafficked freight interstates in the country.
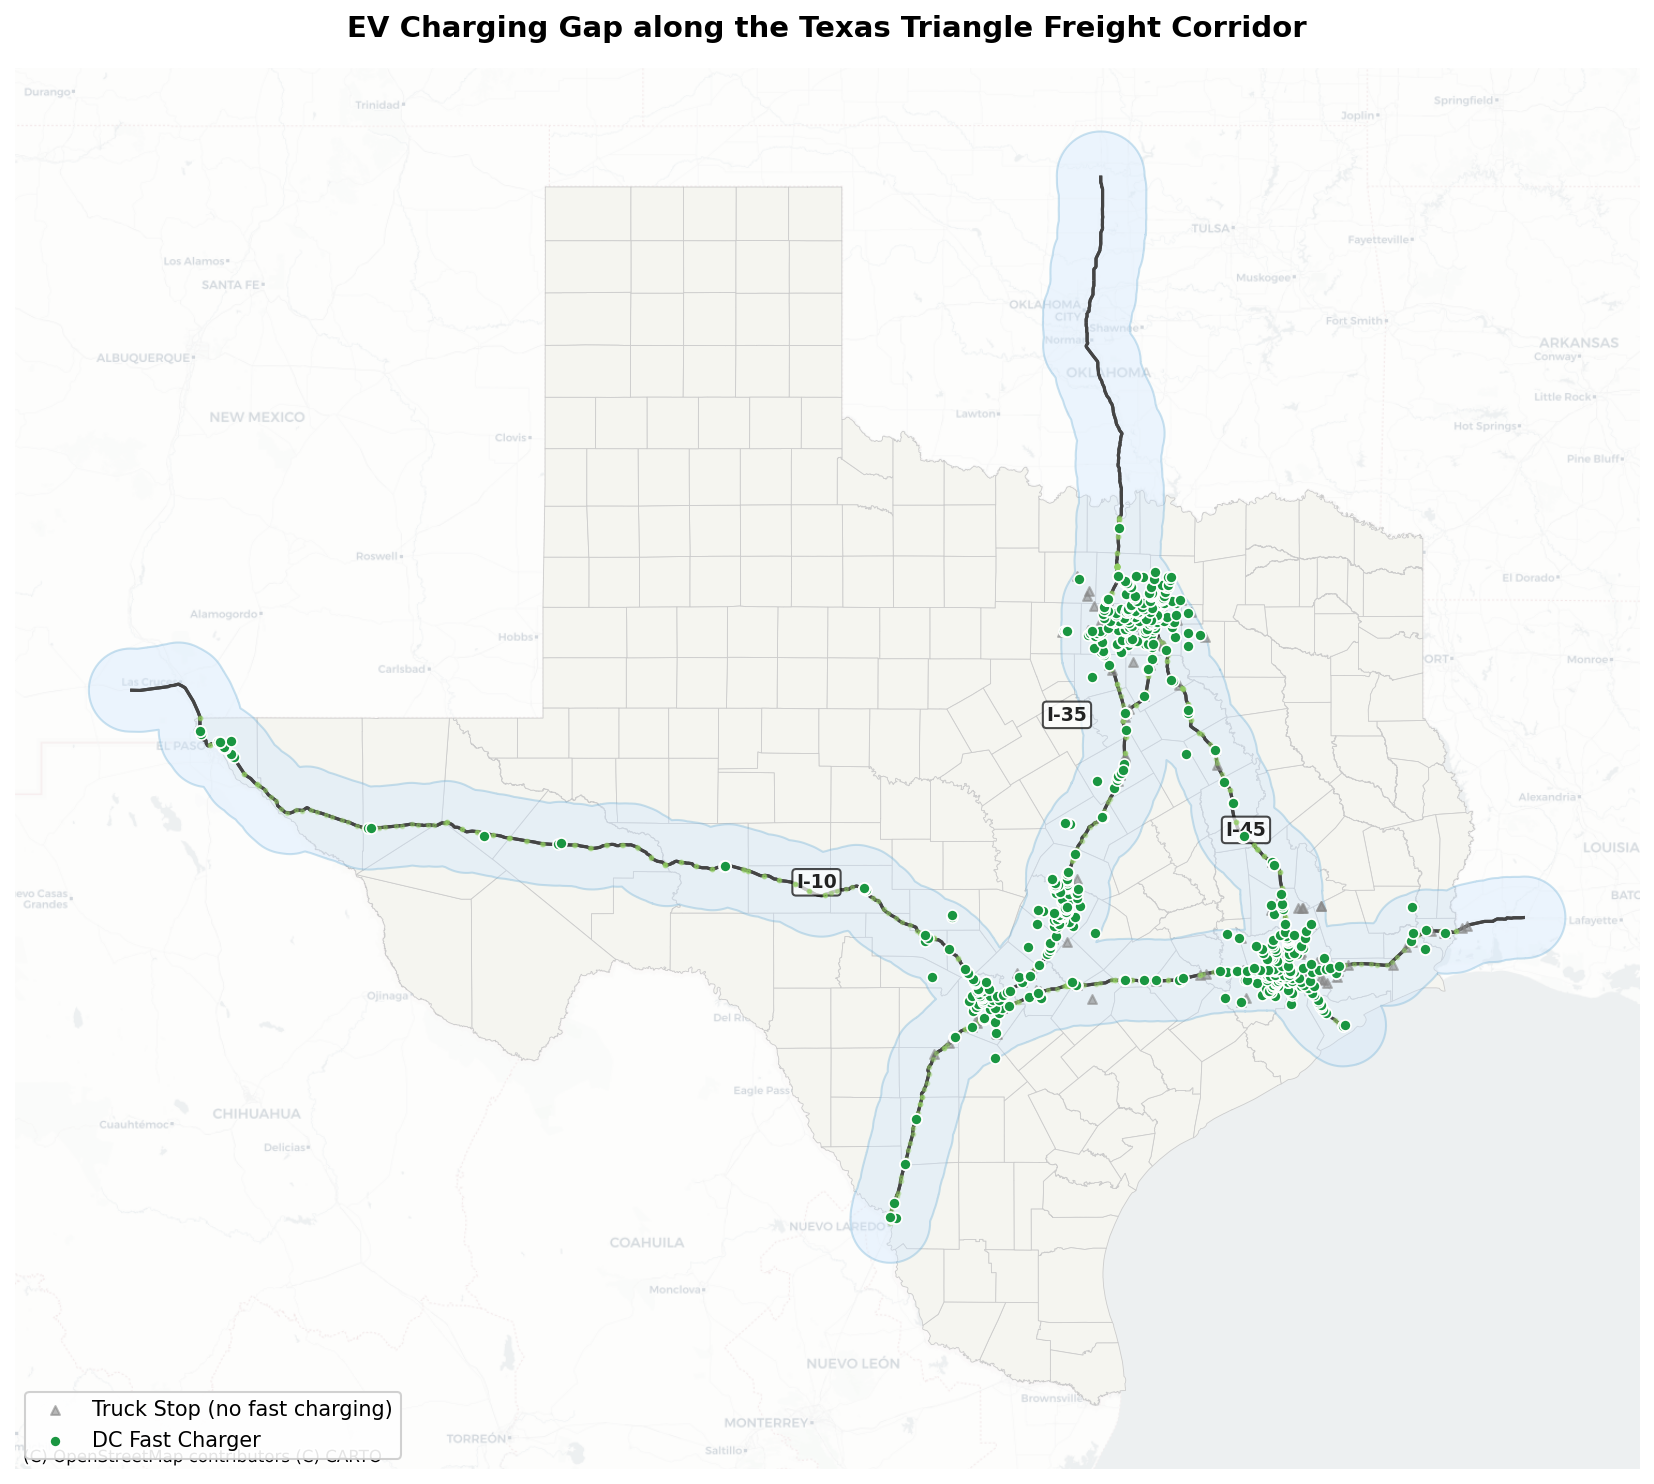
The corridor has 629 DC Fast chargers, a median distance of 1.8 miles to the nearest charger, and an average distance of ~10 miles station-to-station anywhere across the three interstates. For urban freight on that route, the infrastructure is there today.
But that aggregate number masks real variation between the three highways.
Finding 2: I-10 is the Weak Link
When you break coverage down by highway, the asymmetry becomes clear:
| Highway | Sample Points | Charging Deserts | Max Gap (Point to Station) | Safety Margin |
|---|---|---|---|---|
| I-10 | 253 | 25 | 47.5 mi | 2.5 mi |
| I-35 | 255 | 0 | 27.5 mi | 22.5 mi |
| I-45 | 294 | 0 | 13.2 mi | 36.8 mi |
I-45 and I-35 run through the more urbanized parts of Texas, so chargers cluster naturally around city infrastructure. I-10 crosses long rural stretches with fewer population centers, and the result is a maximum gap of 47.5 miles on I-10, just 2.5 miles under the desert threshold.
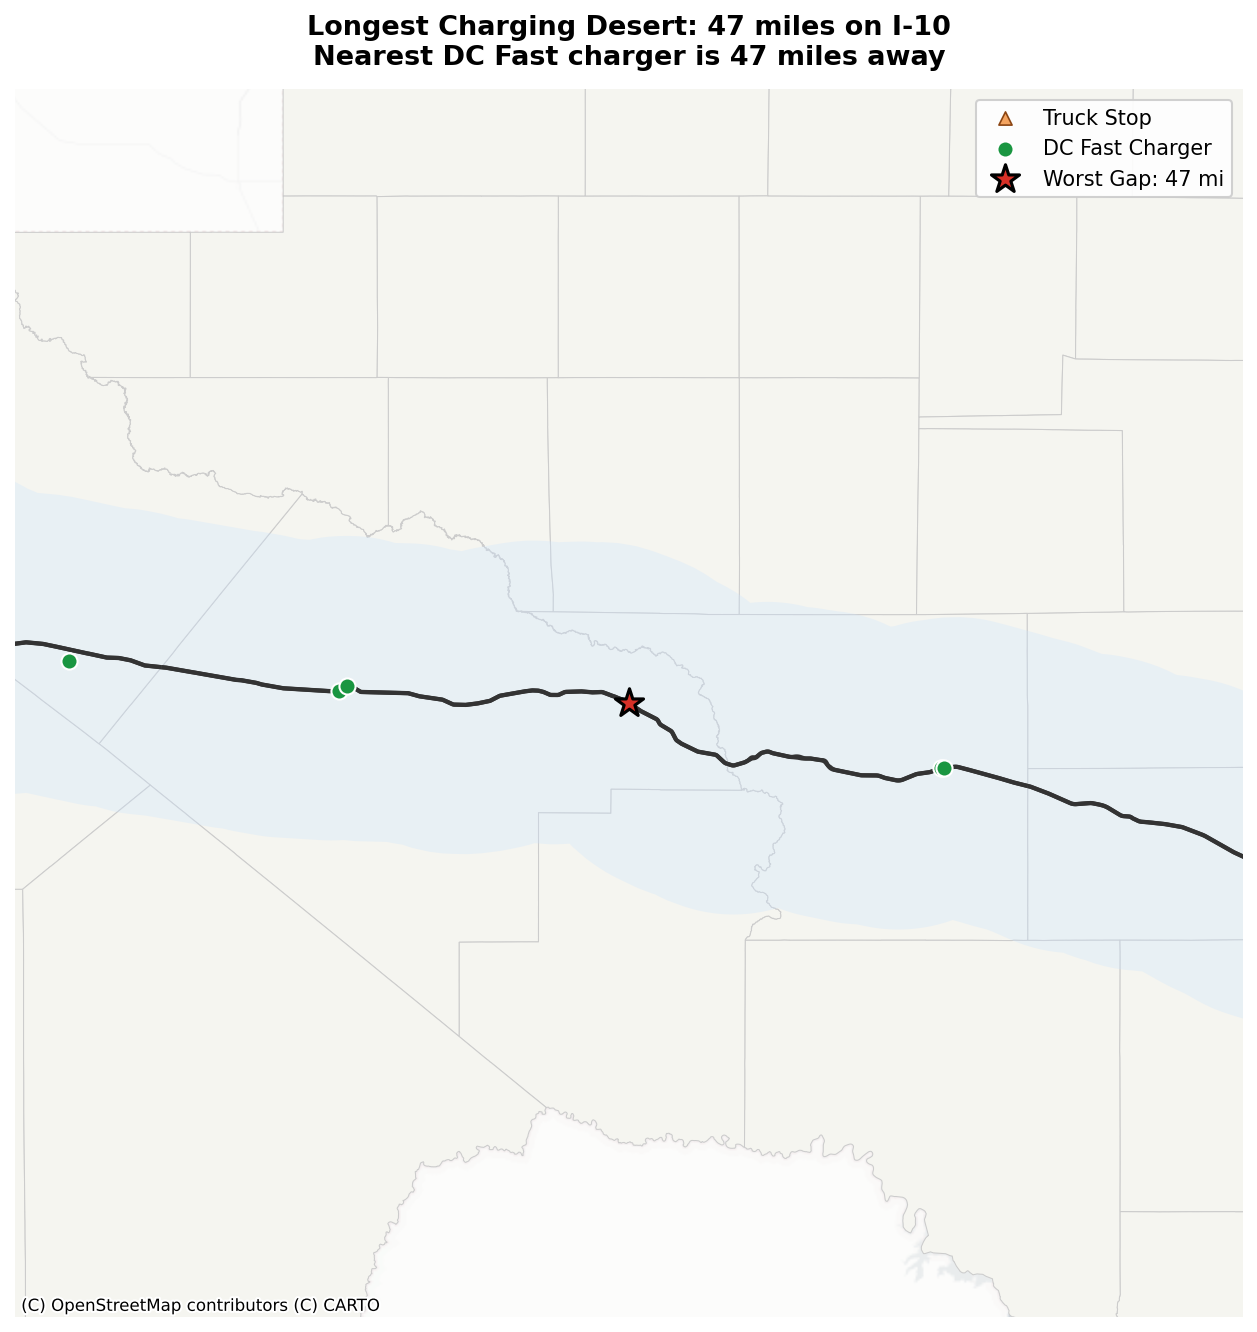
That gap sits in a remote stretch of west Texas near Fort Stockton, a town of around 8,000 people in a sparsely populated oil-producing region. There are truck stops in the area, but the nearest DC Fast charger is 47.5 miles away. The 47.5 miles is measured from the worst sample point to the nearest charger, meaning it represents the midpoint between two stations. The actual station-to-station gap is roughly 95 miles, nearly double the NEVI Formula Program’s 50-mile maximum spacing standard for Alternate Fuel Corridors. By federal station-spacing standards, I-10 already has a charging desert.
Finding 3: Two Stations Away from a Crisis
The I-10 corridor does not pass the desert threshold. The gap near Fort Stockton is served by essentially one station cluster: the Flying J Travel Center Tesla Supercharger and a Walmart Electrify America station a mile further away. If Fort Stockton’s stations go offline during a grid outage or maintenance, the gap between the next nearest chargers stretches to roughly 150 miles with nothing in between.
Texas has experienced exactly this kind of scenario before. Winter Storm Uri in February 2021 knocked out power for millions of Texans for days. If something similar happened during peak freight season, drivers on the I-10 corridor could end up stranded in that remote stretch of west Texas with no viable charging option for over a hundred miles in either direction.
Compare that to I-45: its maximum gap is 13.2 miles. Removing the nearest charger to any I-45 sample point barely changes the picture, since there are always several nearby alternatives. I-45 has the redundancy that I-10 lacks.
The Interactive Dashboard
I built an interactive dashboard so you can explore the corridor at different zoom levels and see individual charger and truck stop details.
View the Texas Triangle EV Charging Gap Dashboard
You can toggle individual highways on or off, use the distance filter to isolate sample points above a certain gap threshold, and click any point or charger for details. Filtering to points more than 25 miles from a charger and showing only I-10 makes the fragility of the Fort Stockton stretch immediately visible.
Conclusion
With average gap between charging station of ~10 miles, The Texas Triangle passes the EV freight readiness test on average, but I-10 have vunerable area that exceeds federal station-spacing standards. The 47.5-mile maximum distance to the nearest charger translates to a ~95-mile station-to-station gap, nearly double NEVI’s 50-mile maximum. Remove the Fort Stockton cluster and that gap stretches to roughly 150 miles with no charger in between.
The policy implication is that specific EV infrastructure investment should prioritize redundancy on I-10’s rural stretches, not additional density in already well-served urban corridors. Adding more chargers to an already-dense urban section does nothing for a truck driver on the rural stretch of I-10. Filling the gap with a second independent station cluster, ideally on a different grid connection, would meaningfully reduce the risk of that stretch.
Could We Do This in Indonesia?
This analysis came together quickly because the data was ready for it. Charger locations came from the NREL AFDC, a federally maintained registry with a clean API. Highway geometry came from the US Census TIGER/Line dataset via a single pygris function call. Both are structured and built for exactly this kind of spatial query.
Indonesia’s EV ecosystem is moving fast, and there’s real energy behind it. Community efforts like Pom Listrik have done impressive work mapping SPKLU locations across the country, and PLN’s mobile app gives drivers real-time station info. These are genuine assets, built by people who care. But running the same corridor analysis on, say, the Trans-Java route from Merak to Banyuwangi would be a very different project today. Neither source exposes a bulk API, which means getting a corridor-wide charger list involves scraping or manual export, with no guarantee the data is complete or current. For road geometry, OpenStreetMap via the Overpass API is workable but slow, and toll road accuracy depends on how recently contributors have updated the tags.
This is where the gap shows up. Indonesia is still in the phase where the data lives in community maps and private apps, each valuable on its own, but a full corridor dataset would likely require weeks of scraping before it’s ready to analyze. For a country where the EV conversation is accelerating and infrastructure decisions are being made right now, that’s a real constraint on evidence-based planning. But once that data infrastructure is ready, corridor-level questions become answerable for any route in the country.
Methods
Tools: Python with GeoPandas, Shapely, pygris; QGIS; Leaflet and Chart.js for the interactive dashboard
Techniques: Nearest-neighbor spatial join via gpd.sjoin_nearest(), 25-mile corridor buffer, 10-mile sample point interpolation along a merged LineString, CRS EPSG:32614 (UTM Zone 14N) for accurate distance measurement within Texas
Limitations:
- The 50-mile desert threshold is based on the NEVI Formula Program Guidance, which encourages a maximum of 50 miles between charging stations along Alternate Fuel Corridors. Different threshold assumptions would change the specific numbers but not the relative fragility of I-10 compared to I-35 and I-45.
- Physical truck accessibility at charger sites, including pull-through bays and minimum charging power requirements, was not assessed. Some stations in the dataset may not be physically usable by large commercial vehicles even if they appear nearby.
Structure and grammatical editing was assisted by Claude (Anthropic).